Building Shiny Apps
Challenges and Responsibilities
Jessica Minnier
email: minnier@ohsu.edu
@datapointier
Saturday, January 27, 2018, Data/R Day Texas
Slides available at http://bit.ly/shiny-ddtx
Motivation
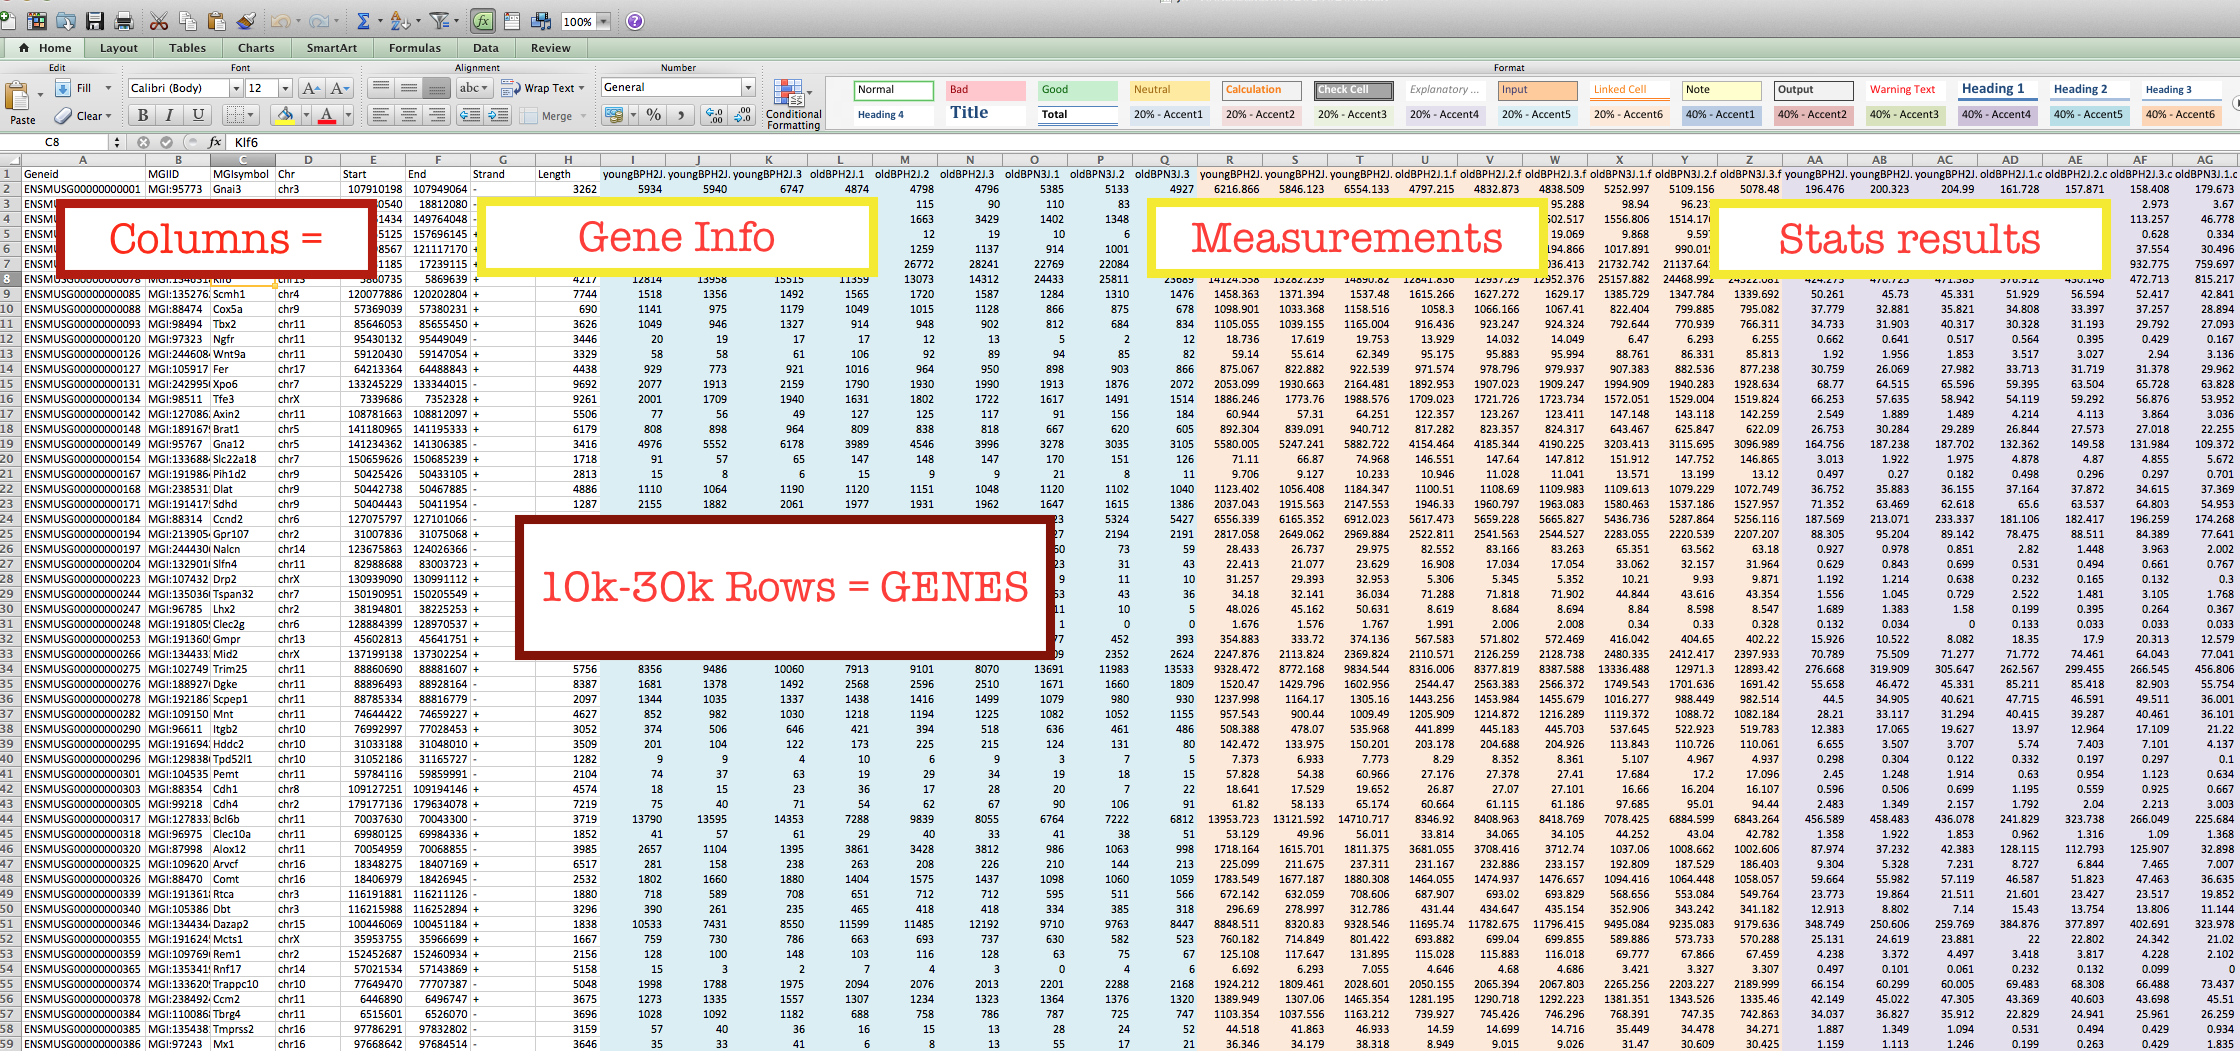
Spreadsheets =(

Motivation
“Can you make me this plot? Ok now this plot? Wait one more plot…”
Enter Shiny

Collaborator:
“How can I share my data?”

Developer/Statistician/Data Scientist:
“How can I get people to use my new method/package?”

Developer/Statistician/Data Scientist:
Look at this analysis I did!

Everyone: Teach Some things! (learnr)

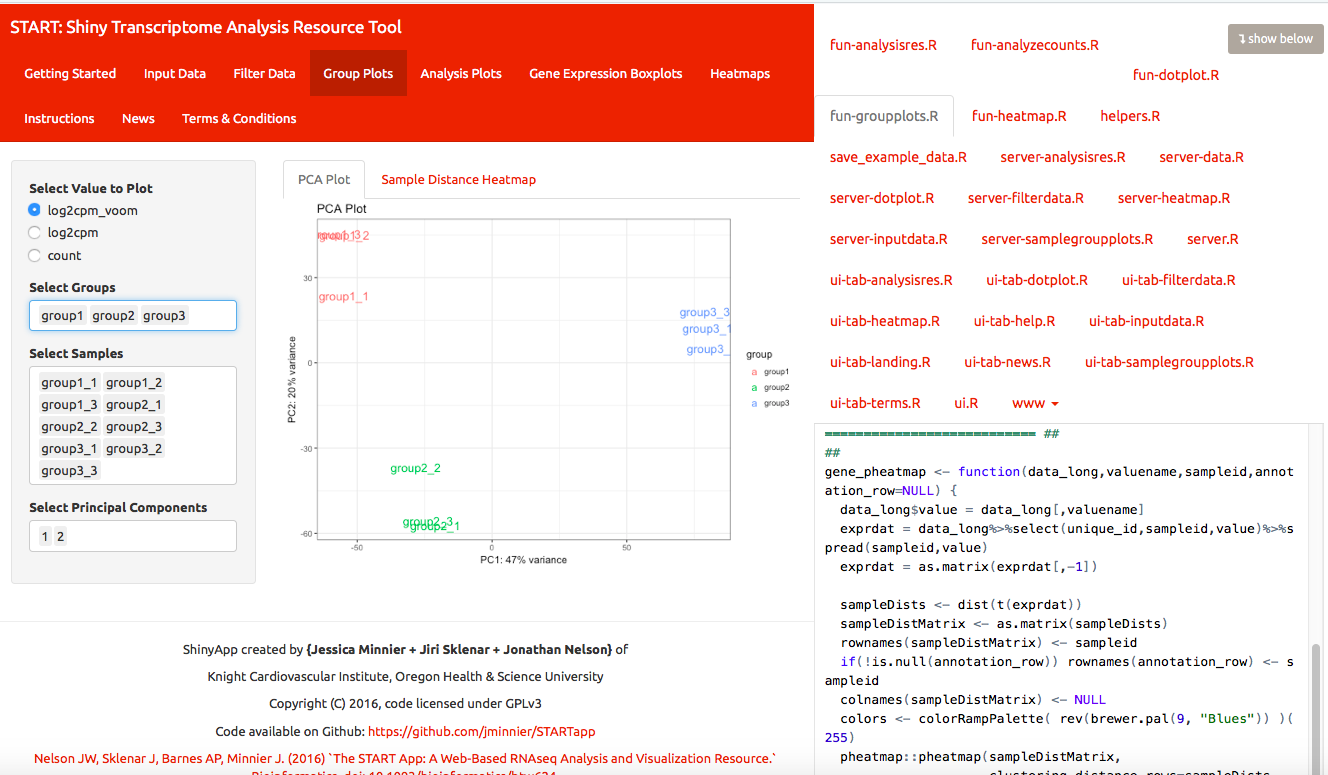
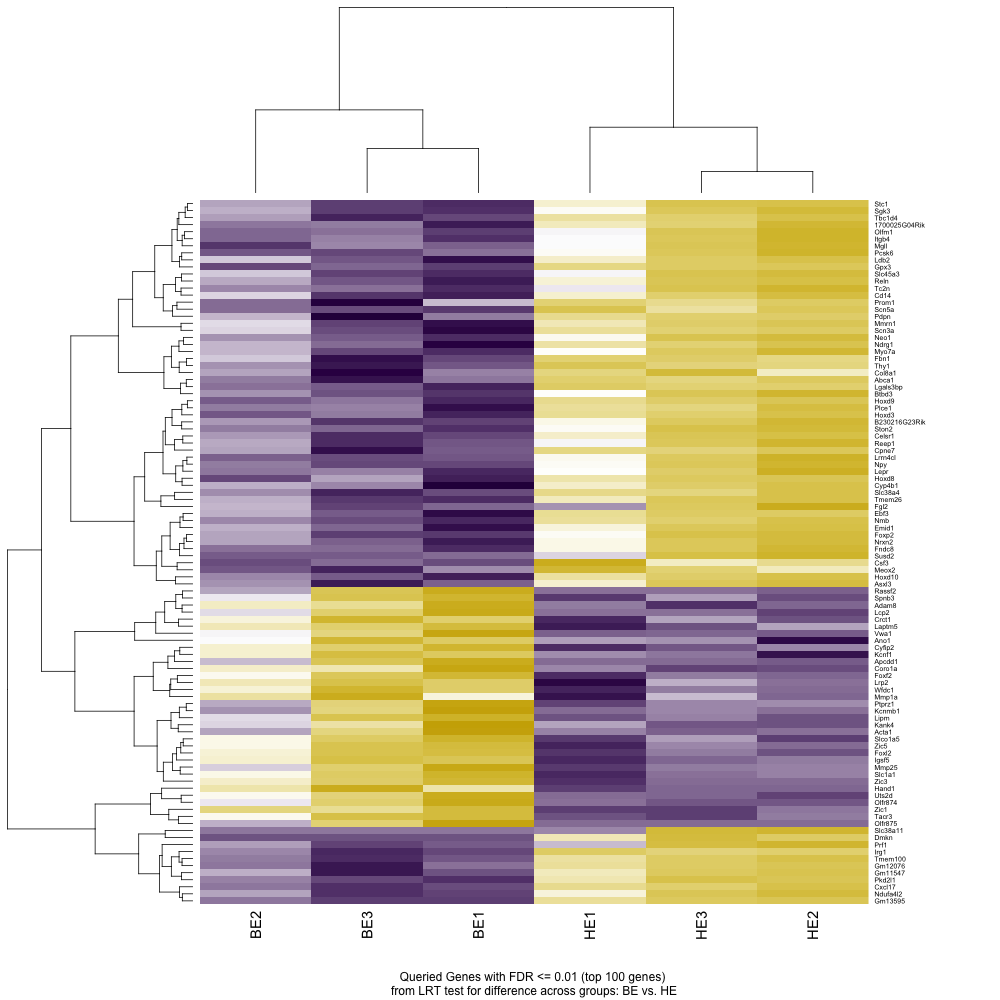
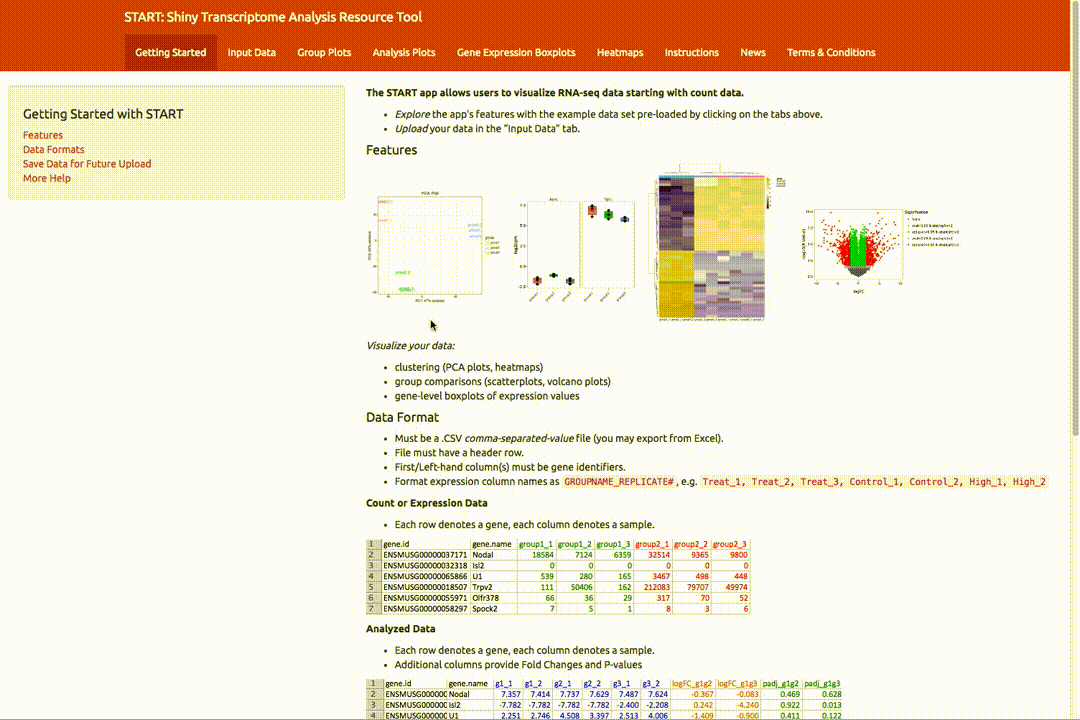
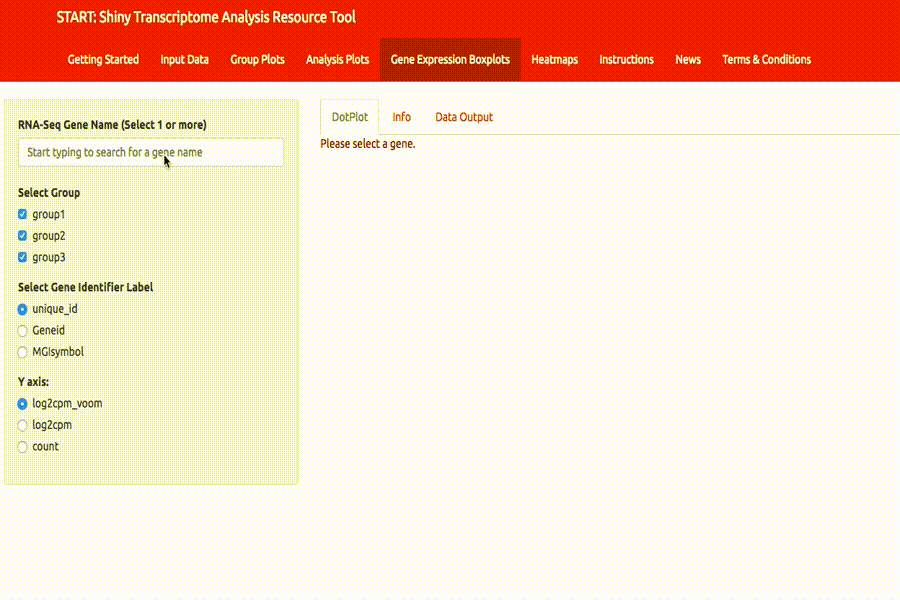
An example: START
Shiny Transcriptome Analysis Resource Tool
Github: https://github.com/jminnier/STARTapp
DATA = RNA-seq gene expression
Very quick tour

Very quick tour
Who is your audience?
Example: START app
- likely biologists
- some not used to coding or large data sets

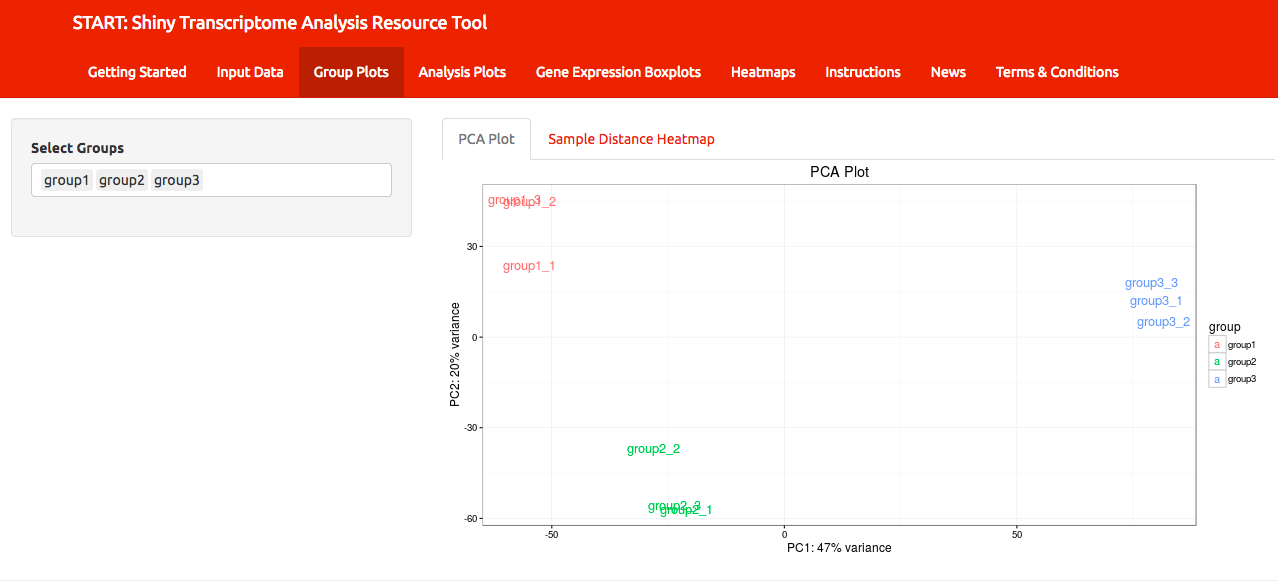
Challenges: User
Data is larger than they are used to + Cannot query or share results easily
Interactive search boxes/filtering + Reactive visualization
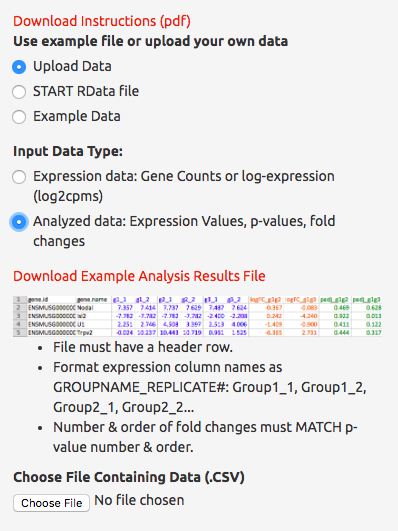
Challenges, Input/Ouput Data
- Input data ~ multiple formats: Special input formats
- Interface with other software? Export special formats
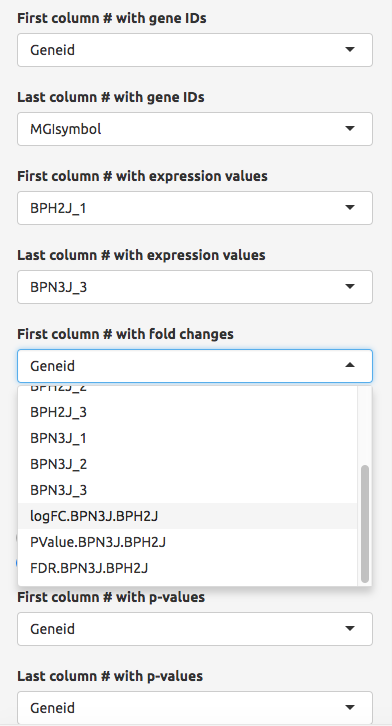
Challenges, Input/Ouput Data
- Input data ~ multiple formats: Special input formats

Challenges, Input/Ouput Data
- Input data ~ multiple formats: Special input formats

Challenges, Analysis
Many possible ways to analyze data:
- Restrict analyses performed
- Allow for uploading of analysis results
Challenges, Analysis
QA/QC
Present QA plots up front
Challenges, Analysis
QA/QC
Present QA plots up front

Landing page - Where am I?
- Show what the app is for/can do
- Point to instructions and guidelines
Bonus: Jasmine Dumas has a shinyLP package to help! 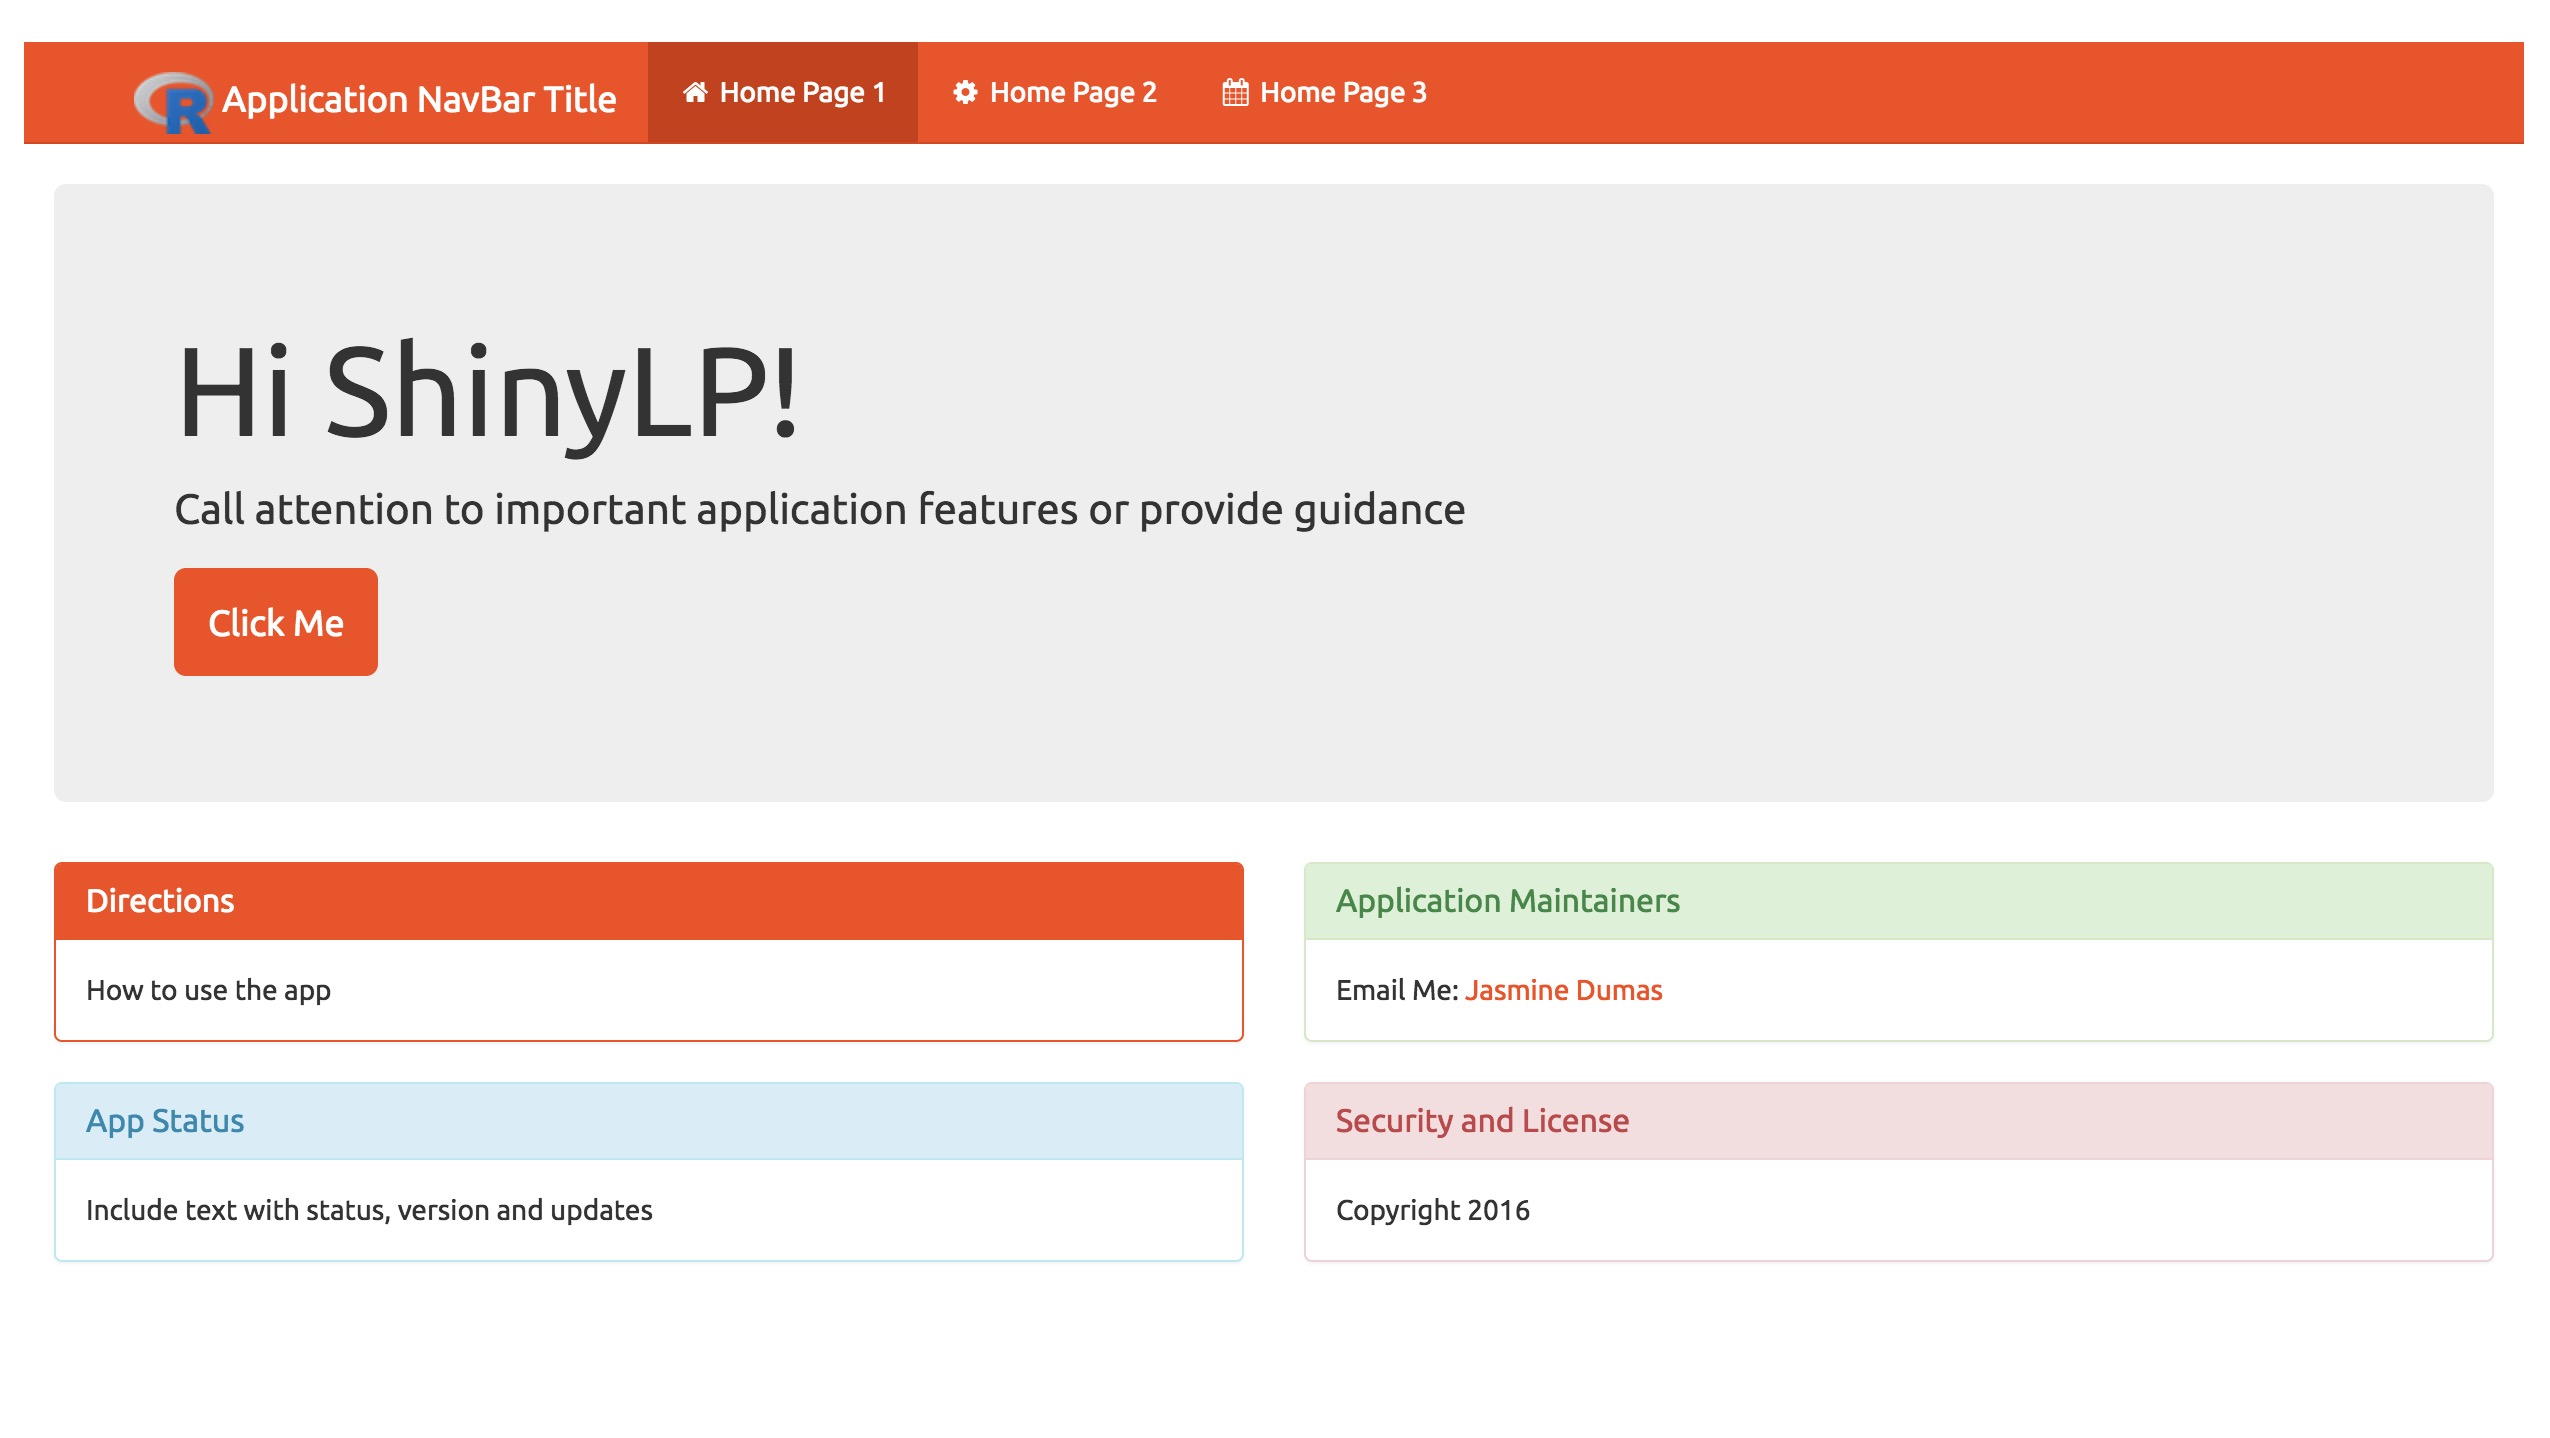
Instructions
Tauno Metsalu and Jaak Vilo: “Clustvis” 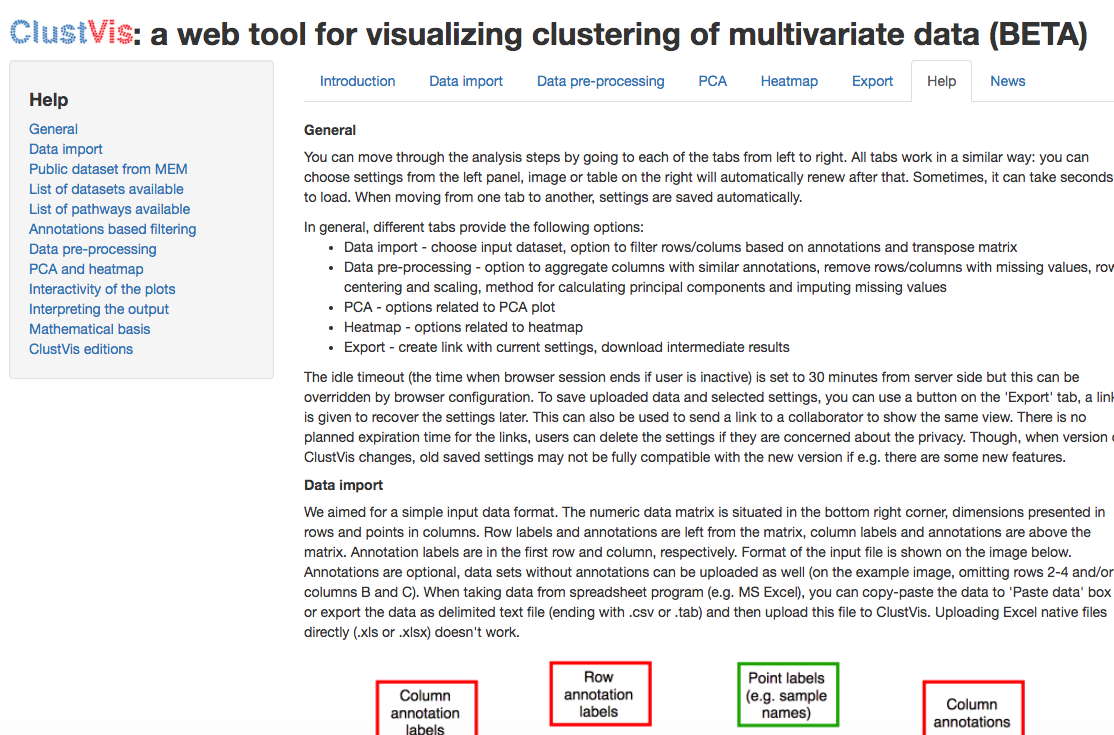
Instructions
Tauno Metsalu and Jaak Vilo: “Clustvis” 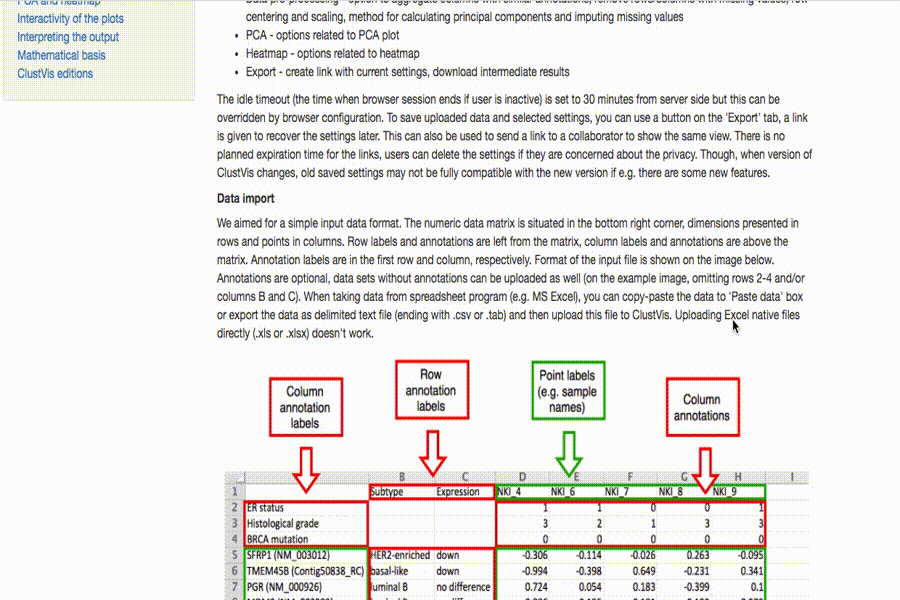
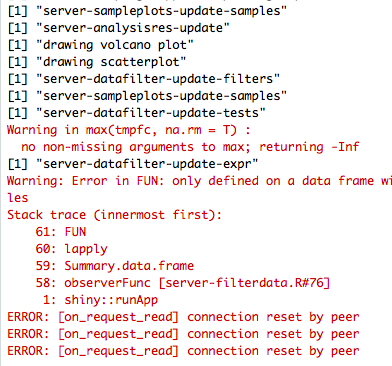
Debugging Tips
Debugging is notoriously a pain here
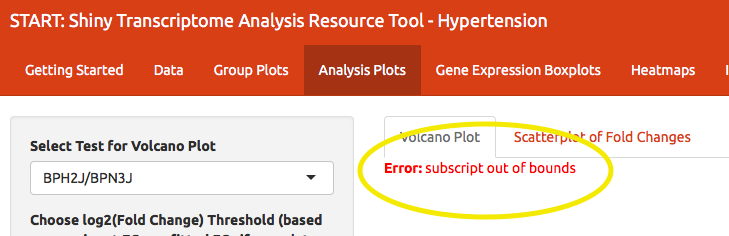
Thanks, stack trace:
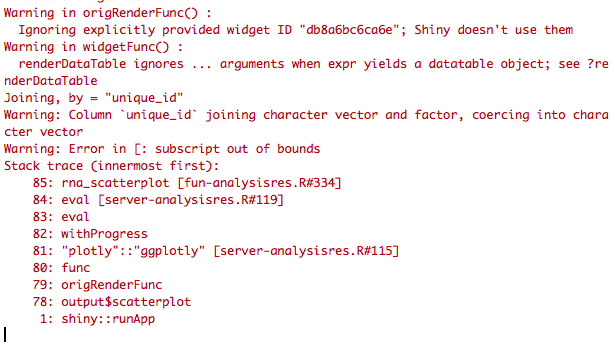
Old fashioned methods work best
Breakpoints and tracing:
browser()- I didn’t say it was funprint()- every single function/observe statement gets a print
New methods are also nice
runApp(..., display.mode="showcase")
But, doesn’t show why something broke.