Is n=3 enough? How to approach sample size and power calculations
Jessica Minnier, PhD
Knight Cancer Institute Biostatistics Shared Resource
Oregon Health & Science University
AACR, March 30, 2019
bit.ly/aacr-power
datapointier
Goals of sample size and power calculations
- Design a study that will have enough information about underlying population to reject a hypothesis with high confidence.
- Calculate the number of sampling units (e.g. people, animals) you need to estimate statistics with a certain level of precision.
Design your study
Step 1: State your research hypothesis
- Define your:
- Population
- Outcome variables/measurements
- Predictor variables (i.e. treatment, age, genetic mutation)
- Be specific!
- Example: Among women (population you sample from), the BRCA1 mutation (predictor) is associated with an increased risk of developing breast cancer (outcome).
- Question: How many women do we need to sample/study to determine that BRCA1 is associated with breast cancer?
Your hypothesis and design inform your analysis method.
Step 2: Choose your analysis and test(s)
- You can't calculate sample size without knowing which test and model you will use.
- How will you measure your outcome? Continuous? Categorical? Binary (yes/no)?
- choose outcomes with high sensitivity and low measurement error
- How many groups/experimental conditions/predictors?
- the more you have the more samples you will need
- What test? t-test? Linear regression? Random effects model? Chi-square test?
Calculate sample size based on analysis method you will use.
Calculate power and sample size
Need to know (/tell your statistician!):
- Overall design (outcome, endpoint, hypothesis)
- Size/magnitude of effect of interest
- What do you hope to detect
- Variability of measurements
- Precision of your measurement, biological variability within population
- Level of type I error (false positive rate, significance level, α)
- Level of power (true positive rate)
- Other design details (number of groups, clustering, repeated measures)
Components of Sample Size
Need to know 3 of the 4 to determine the 4th:
| Do We Know? | Measure | Definition |
|---|---|---|
| ?? | Effect Size | Magnitude of difference or association; i.e. (difference in means)/(population standard deviation) = μ1−μ0σ = δσ |
| ?? | Sample Size | N |
| 0.05, 0.01 | Type I Error / Significance level | α = probability of rejecting null hypothesis when it is true |
| 0.9, 0.8 | Power | 1 - β = 1 - Type II error = probability of rejecting null hypothesis when it is false |
What is effect size?
- Summarizes the outcome of interest
- Magnitude of difference or association
- Specification depends on study design and statistical model/test
What is effect size?
- Summarizes the outcome of interest
- Magnitude of difference or association
- Specification depends on study design and statistical model/test
Examples:
- Difference in treatment and control mean outcomes, relative to variance (standard deviation)
- Correlation coefficient of two biomarkers
- Risk ratio of breast cancer comparing BRCA carriers to non-carriers
- Magnitude of regression coefficient
Effect size must be
- pre-specified
- based on what is meaningful biologically or clinically (not statistical significance)
- based on pilot data or literature review if available
Simple example: T-test
Outcome = Continuous measurement, normal distribution
Predictor = Treatment yes/no (treatment vs control group)
Test: two sample T-test, equal variance
Effect Size: difference in means divided by standard deviation of population μtrt−μctrlσ
Null Hypothesis: Difference in means = 0
Alternative Hypothesis: Difference in means ≠ 0
"Given a desired effect size, what sample size gives us enough information to reject the null hypothesis with power 90%, type I error 5%?"
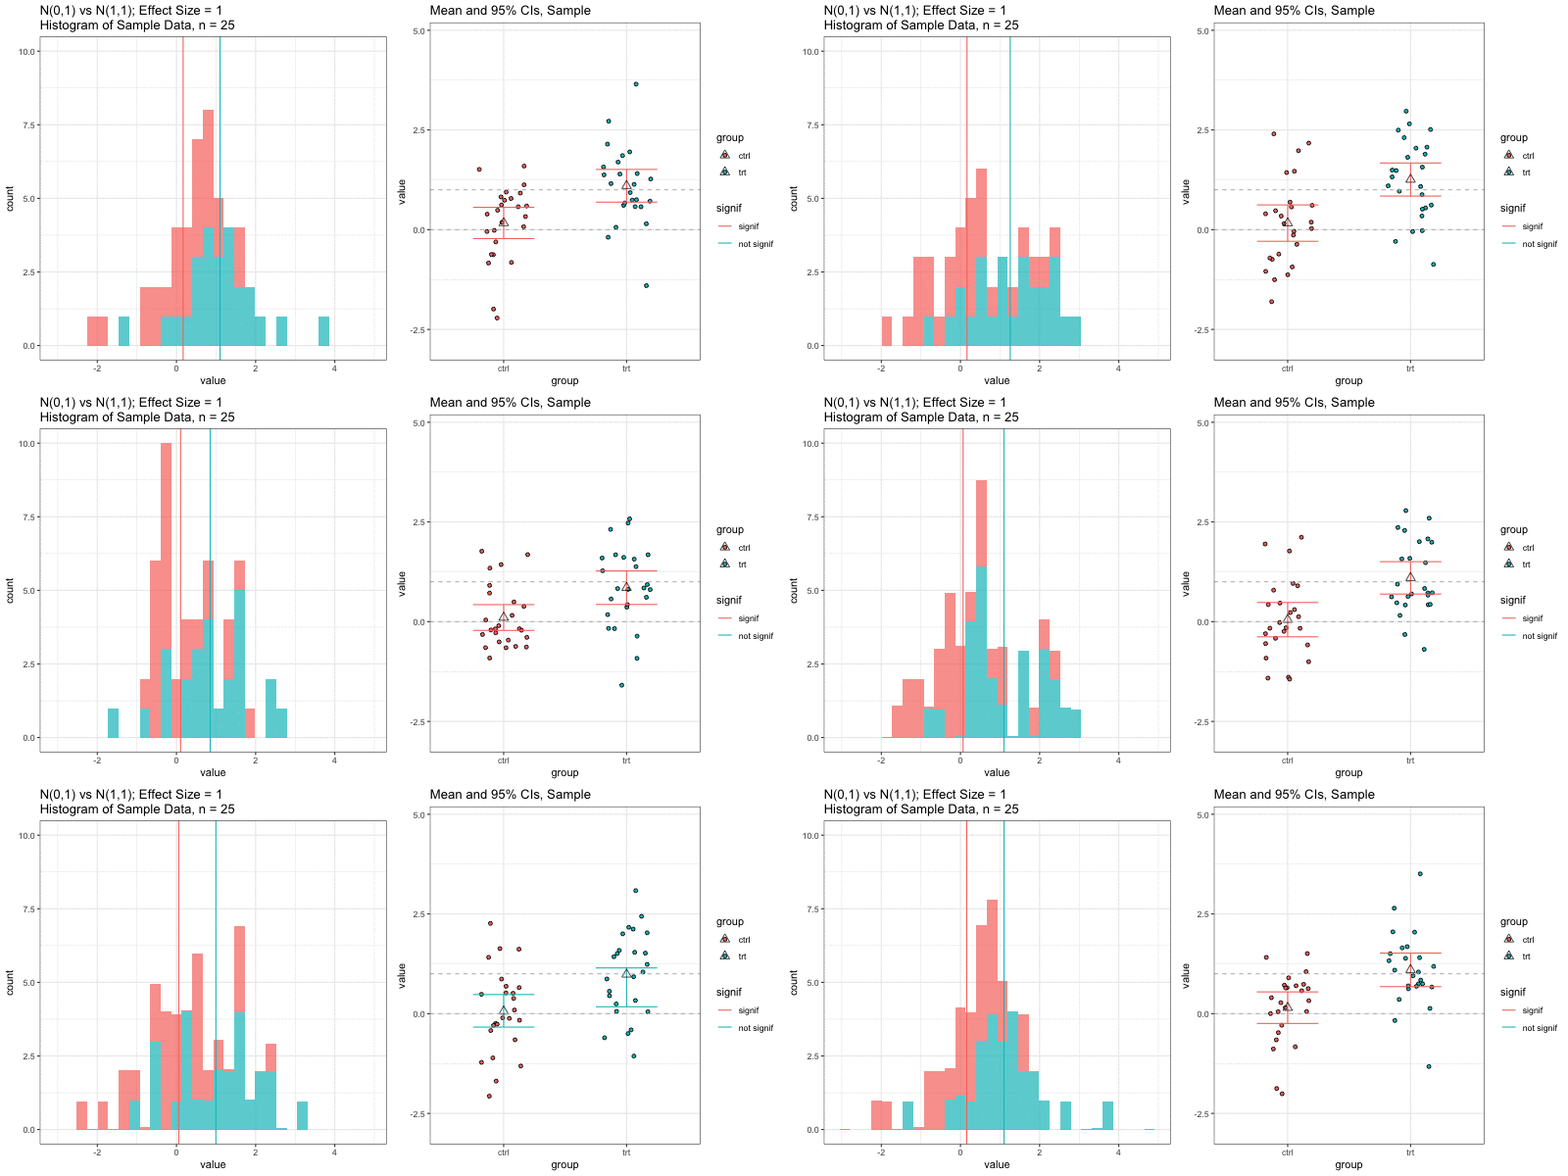
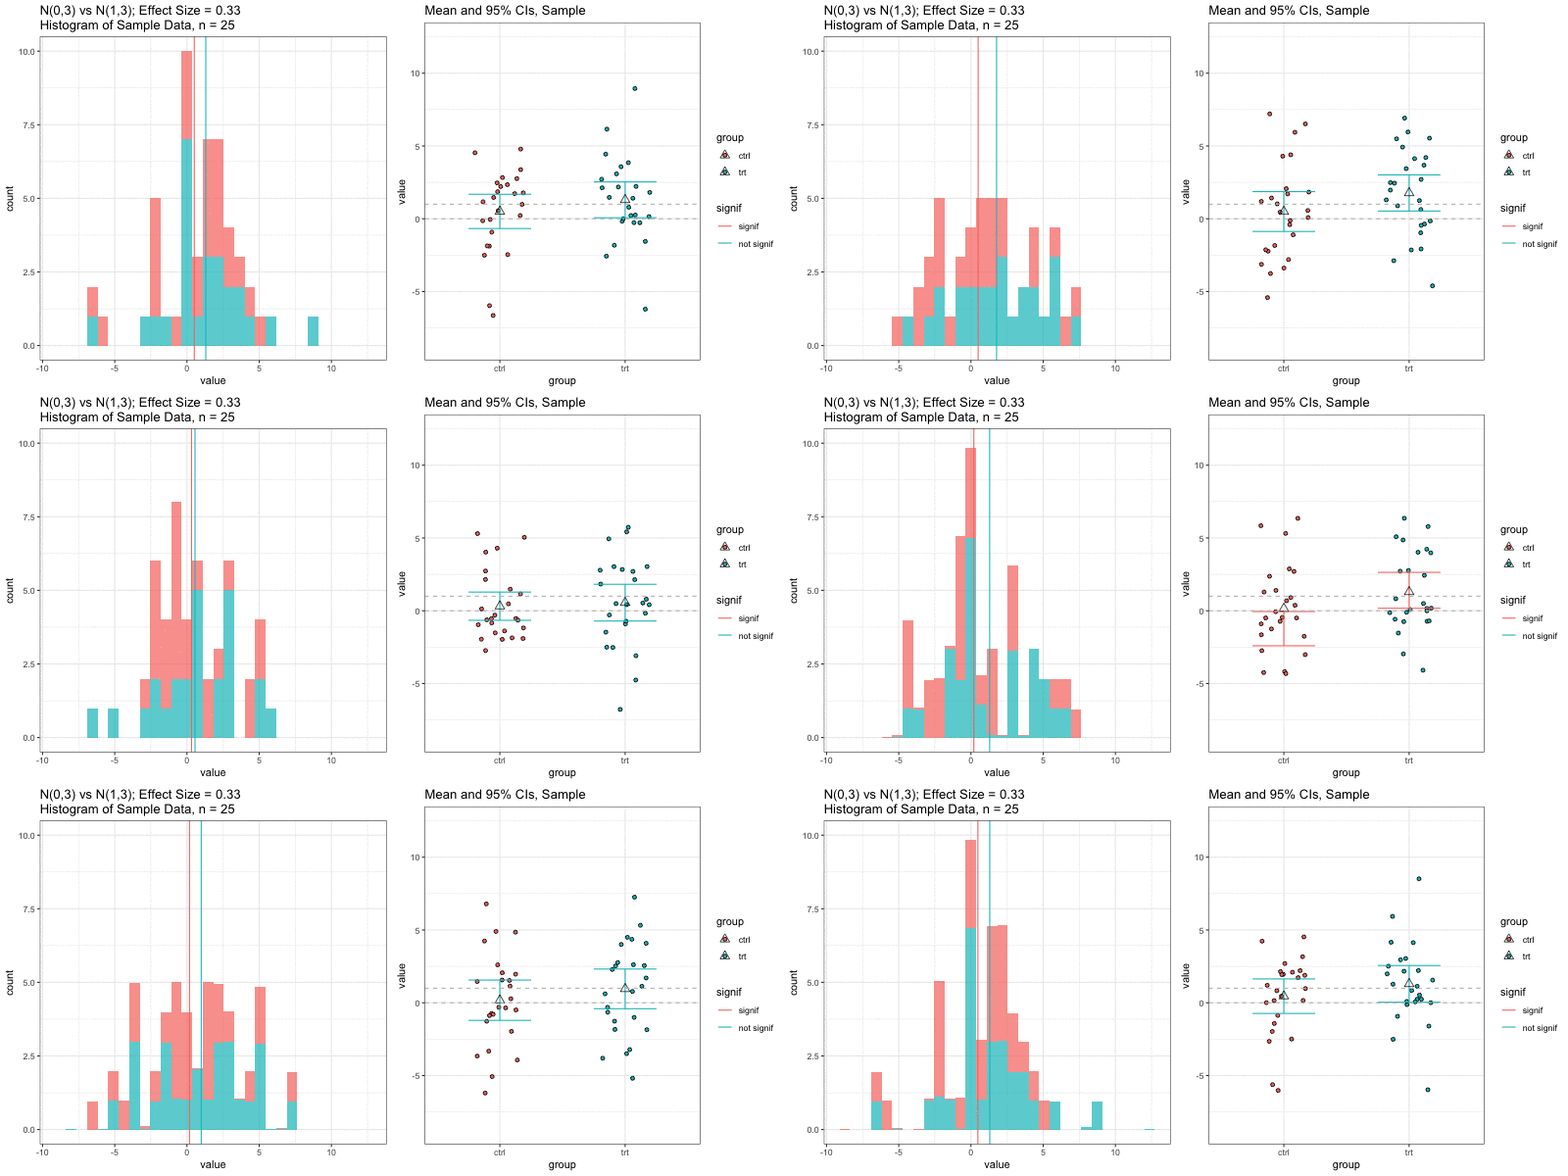
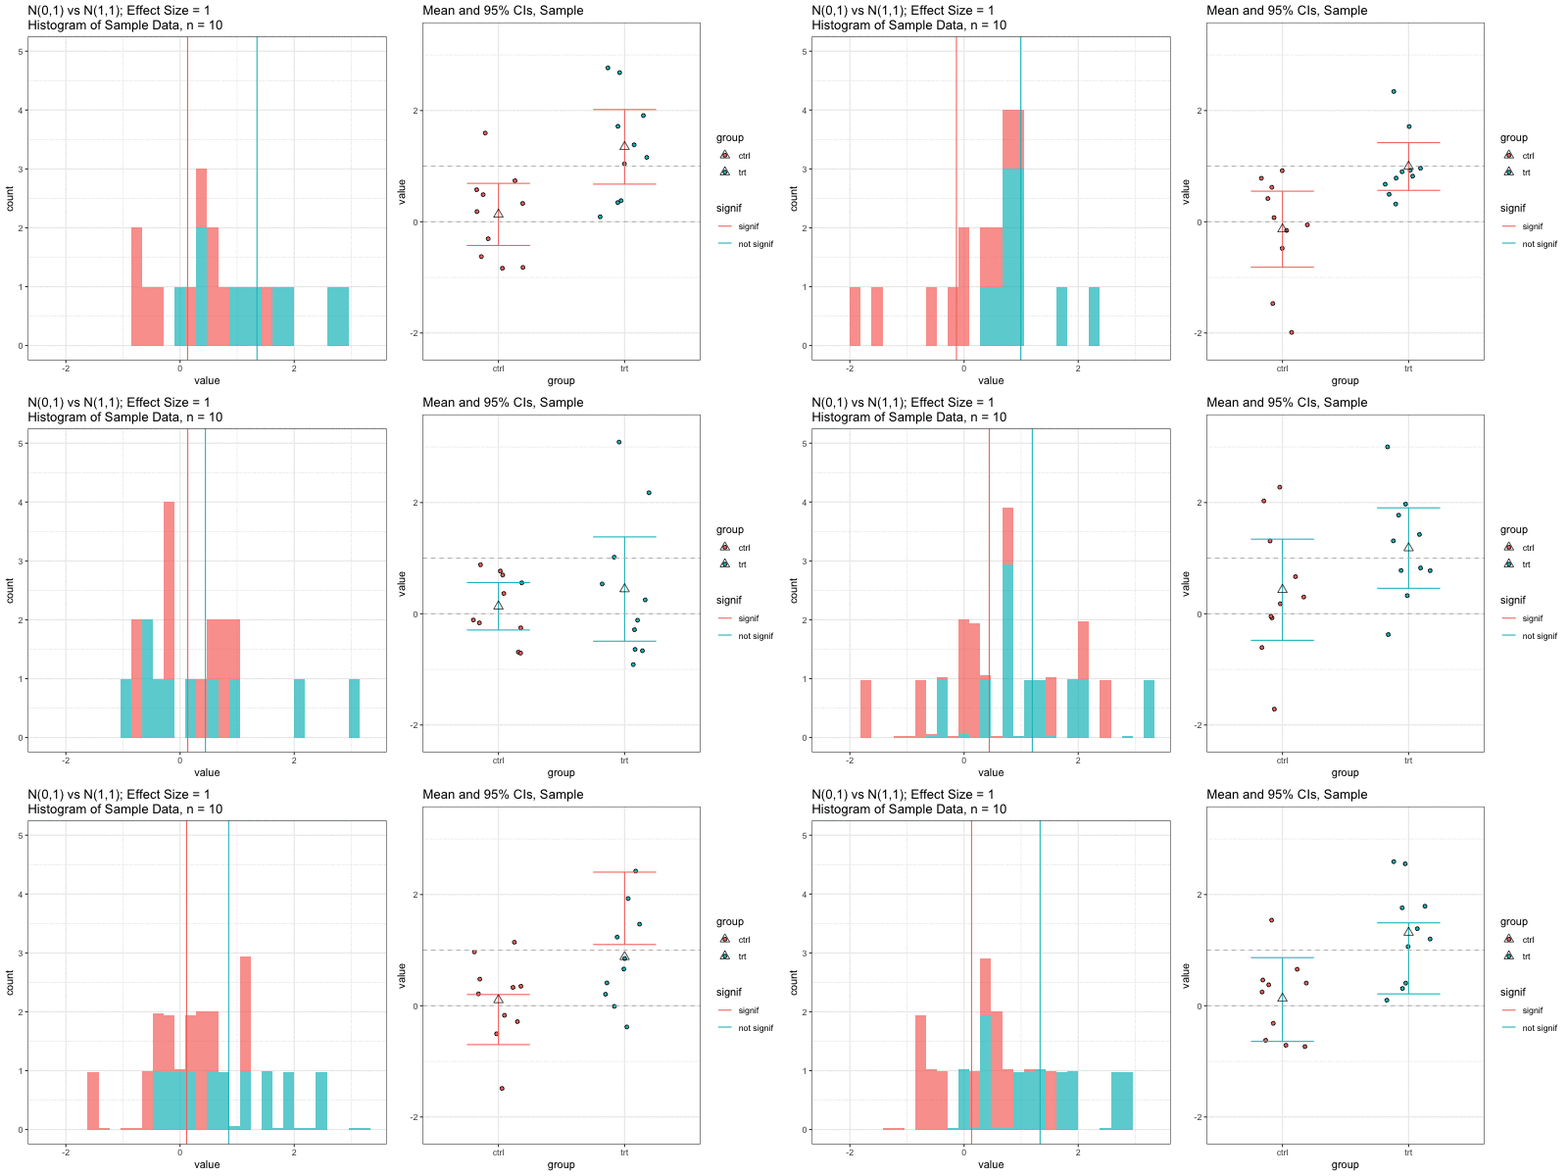
Simulations: underlying data distributions
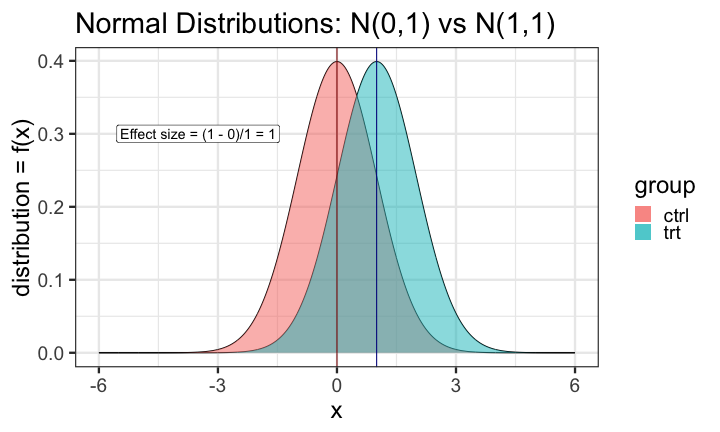
To detect an effect size of 0.33 with power = 0.9 and type I error = 0.05, what sample size would we need? n=194 in each group!
power.t.test(delta = 0.33, sd = 1, sig.level = 0.05, power = 0.9) Two-sample t test power calculation n = 193.9392 delta = 0.33 sd = 1 sig.level = 0.05 power = 0.9 alternative = two.sidedNOTE: n is number in *each* groupn = 3, power = 0.9, effect size = ?
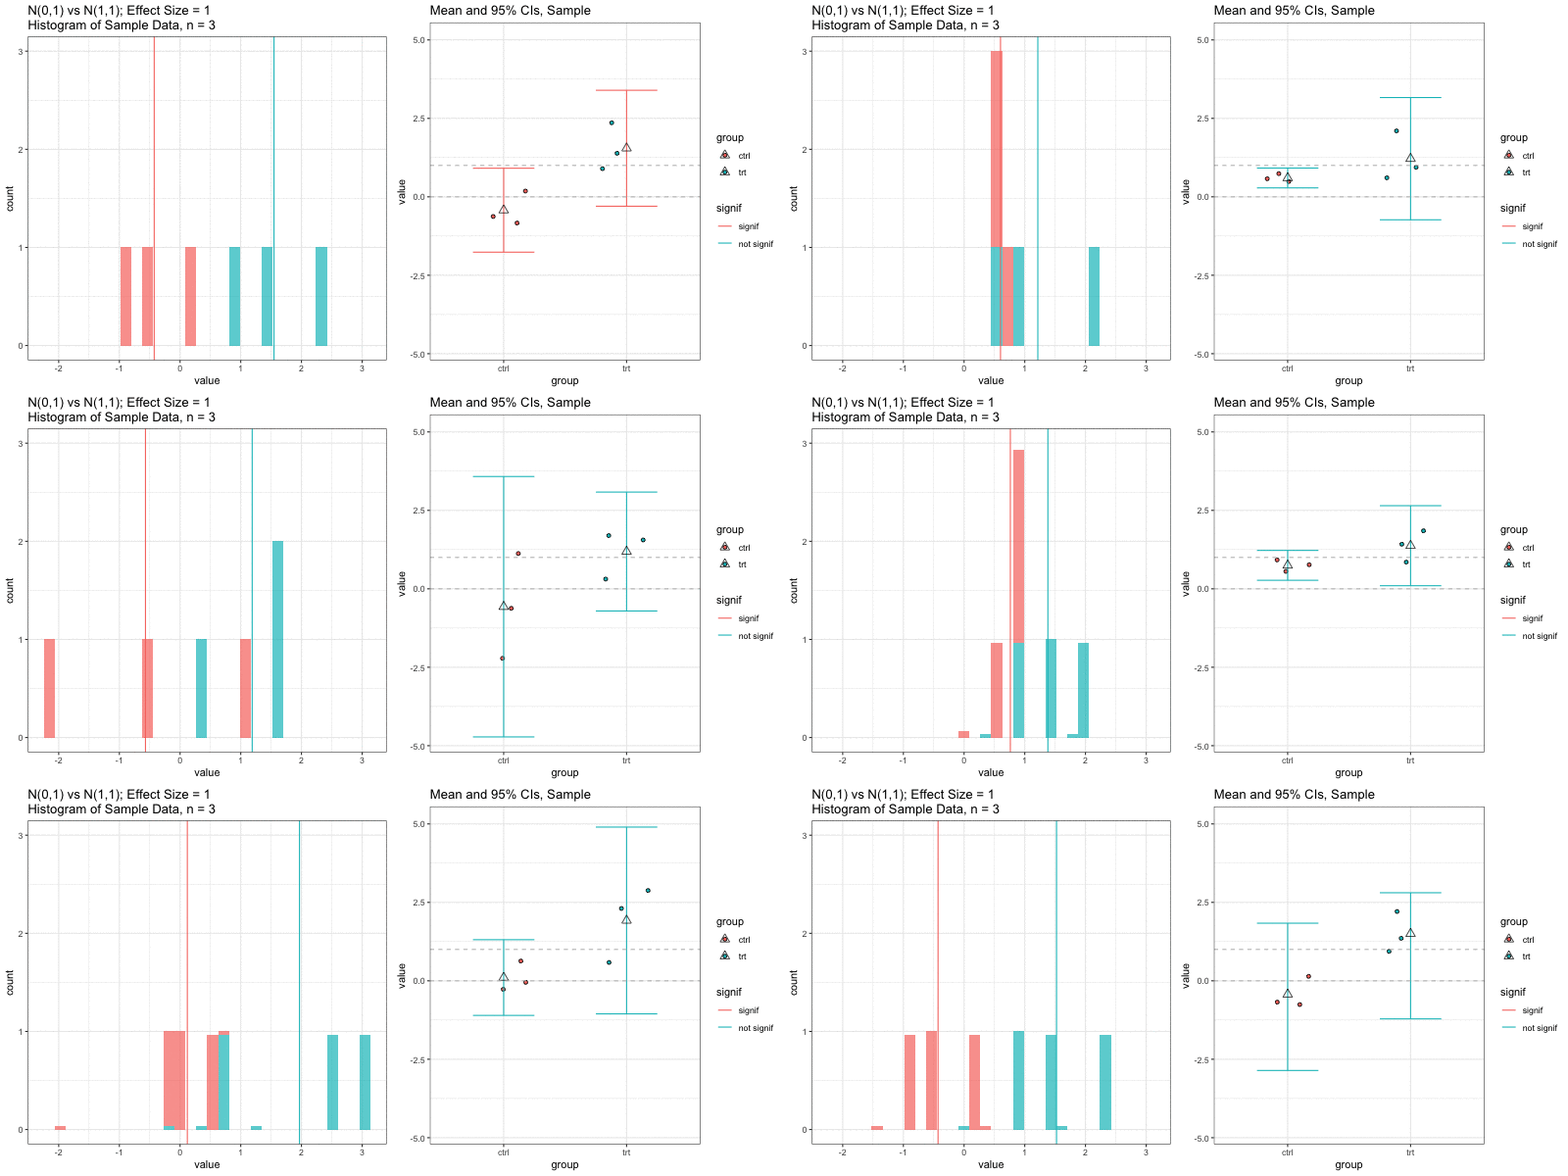
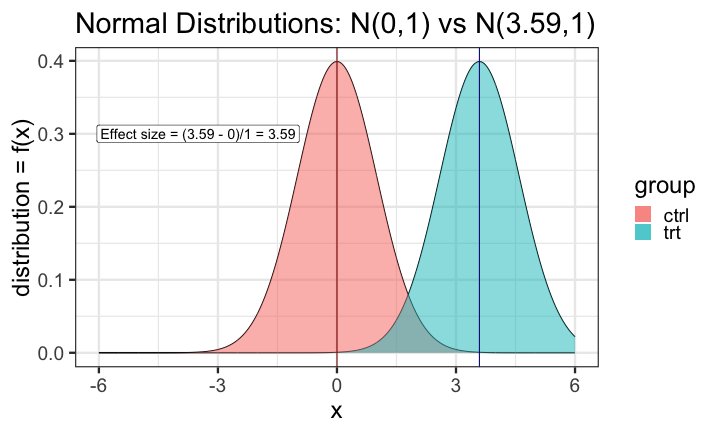
In the R output below, the effect size is delta/sd = 3.59/1 = 3.59.
power.t.test(n=3, sd=1, sig.level=0.05, power=0.9) Two-sample t test power calculation n = 3 delta = 3.589209 sd = 1 sig.level = 0.05 power = 0.9 alternative = two.sidedNOTE: n is number in *each* groupUnderlying data distributions
Other reasons to calculate sample size
Precision of statistics
- Sample sizes can also be calculated for a specific maximum width in confidence interval around an estimate
- i.e. we will estimate the proportion with a 95% confidence interval of width 0.1 such as [0.2, 0.3]
Prediction models
- Large sample sizes are needed for complex prediction models.
- Stability of prediction model accuracy measures depends on sample size.
Important to remember:
Sample size estimates are ESTIMATES.
- based on assumptions that could be incorrect
- based on pilot data that could be a poor sample or too small
- the more you don't know, the more conservative you should be (inflate your n)
- good to provide multiple estimates for a variety of scenarios/effects
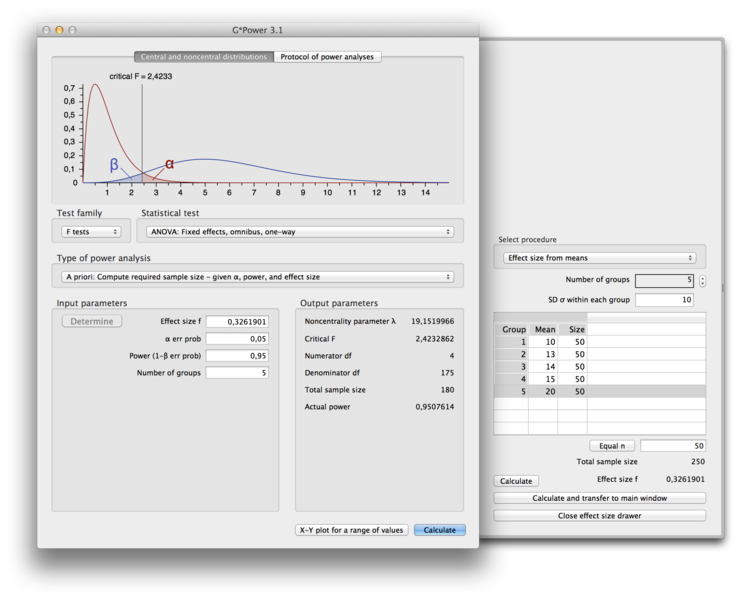
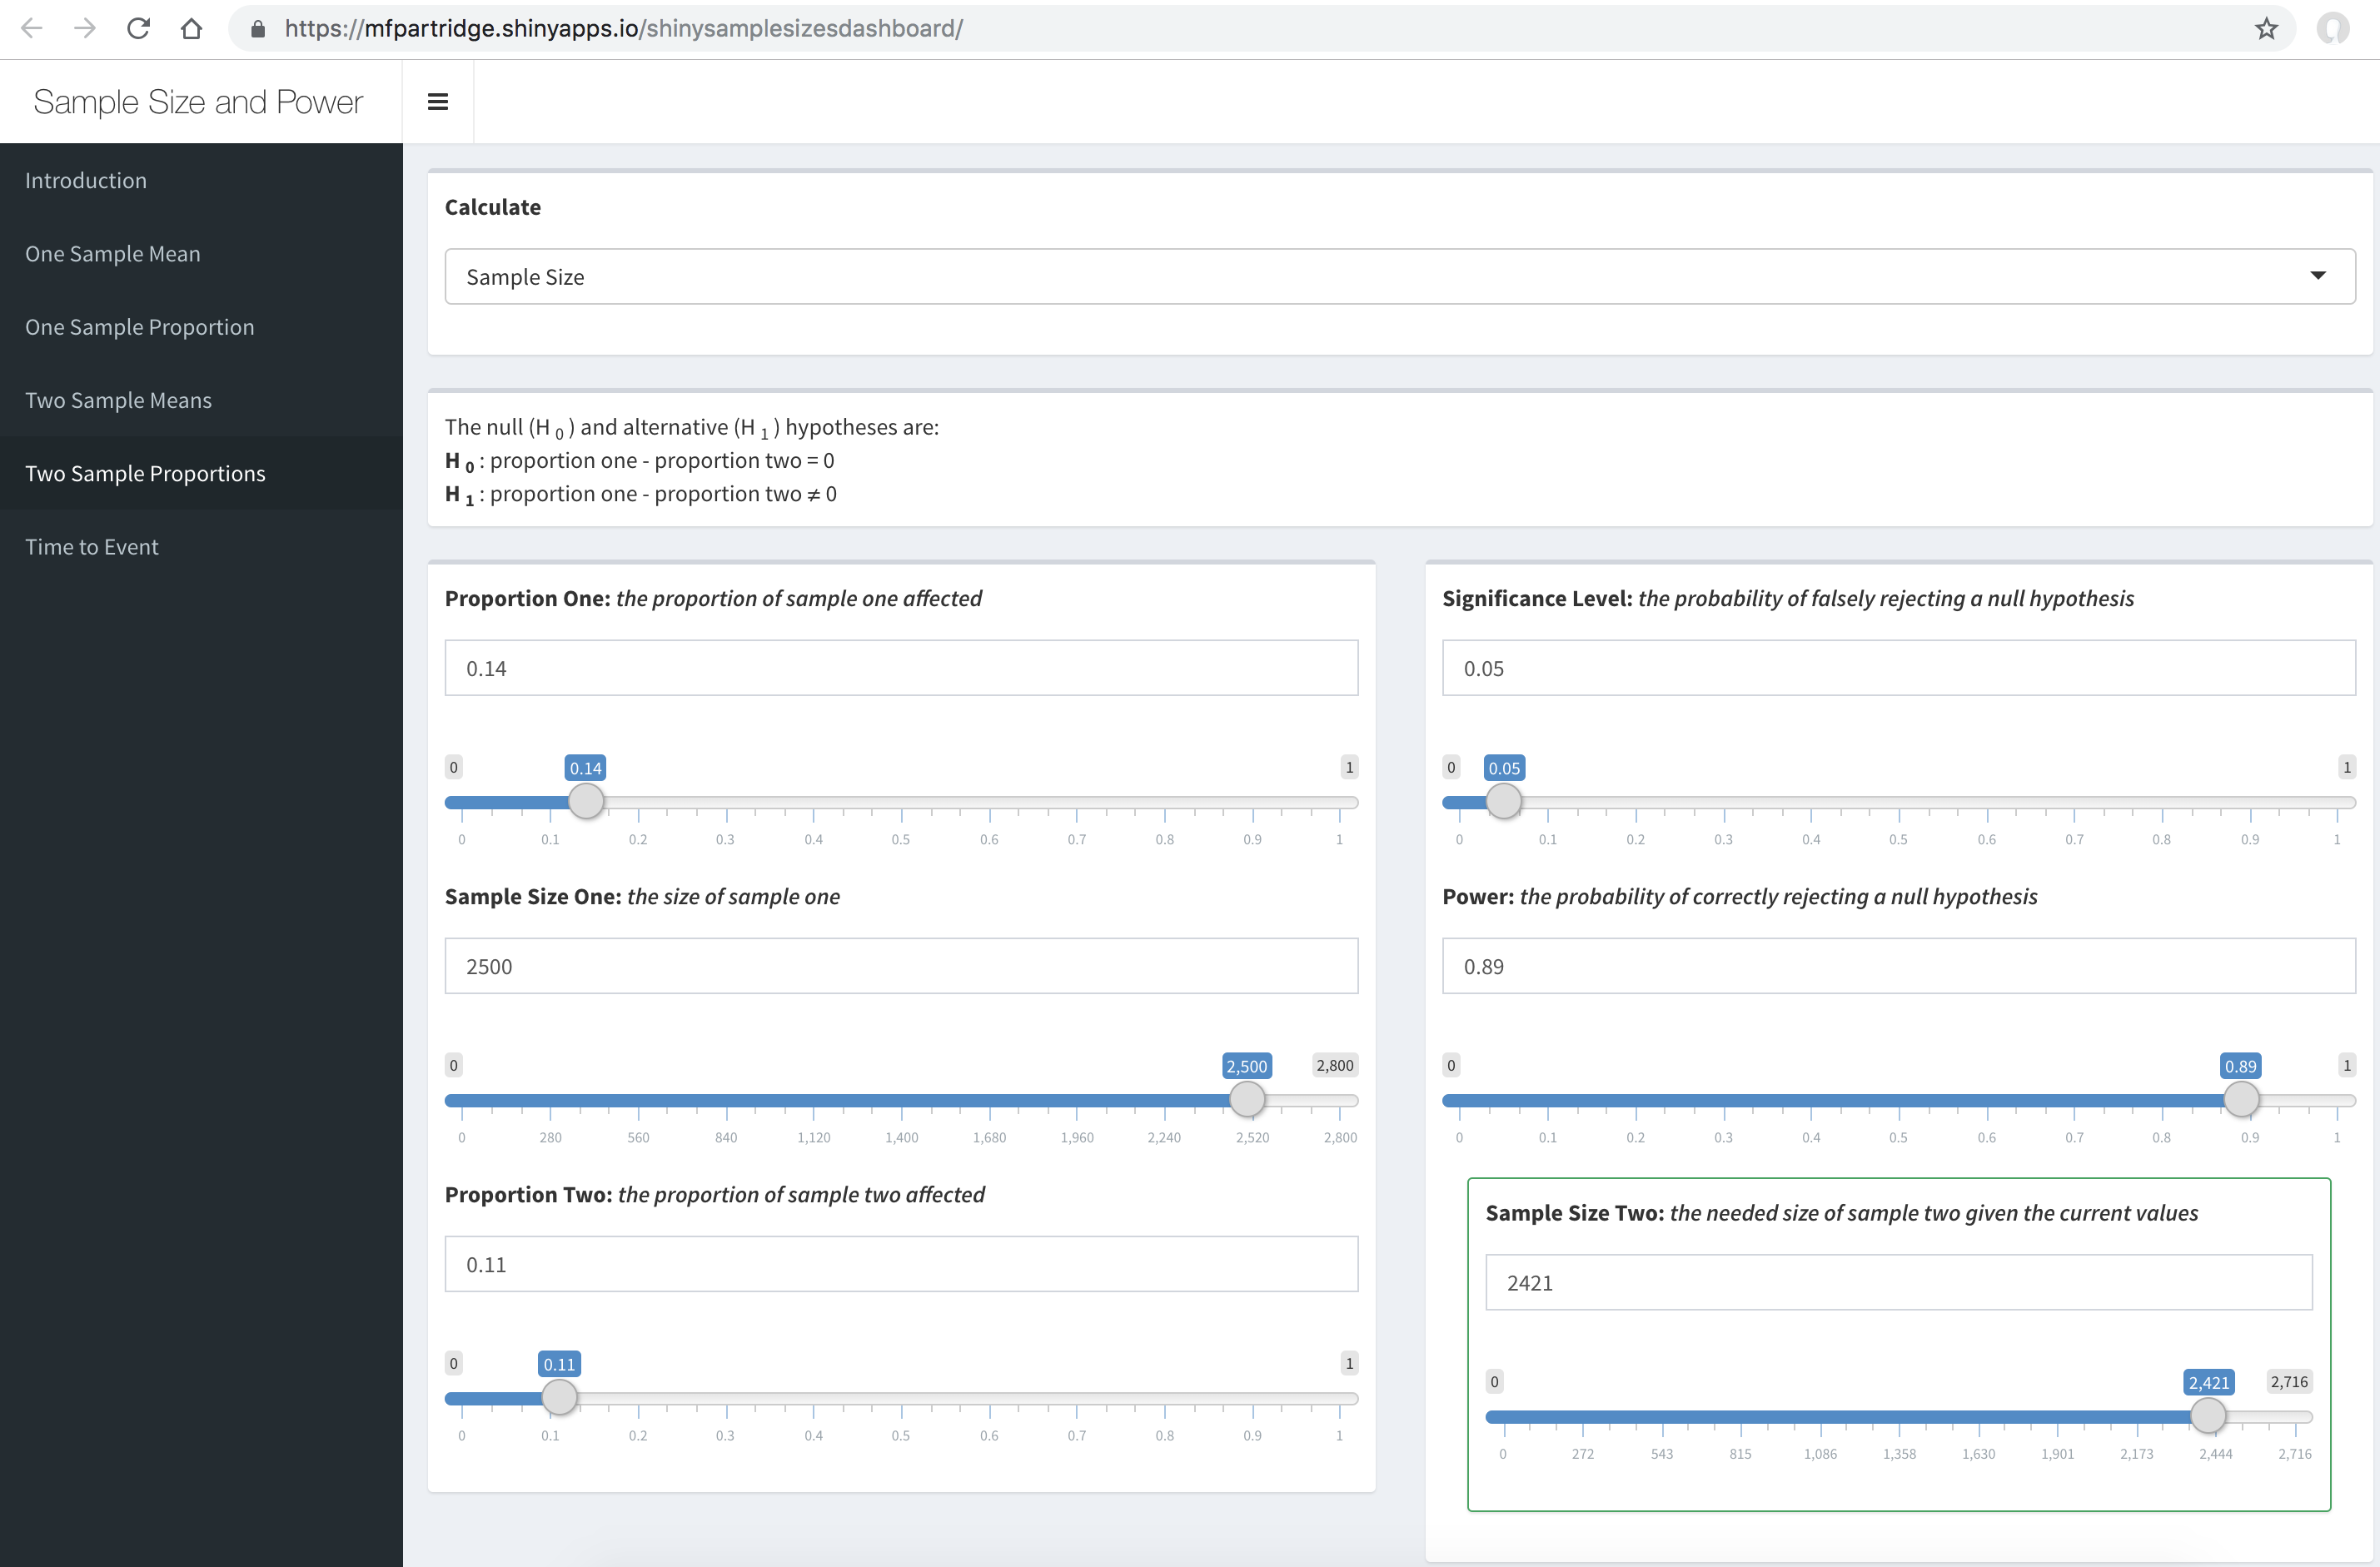
Free online software
Others
- TrialDesign.org
- GLIMMPSE
- CRAB Stat tools
- The Shiny CRT Calculator: Power and Sample size for Cluster Randomised Trials
- Cal Poly Stats Dept Apps
- Statistical software such as R, SAS, STATA
Take home message:
Do your research before you do your research!
Thank you!
Contact me: minnier-[at]-ohsu.edu, datapointier, jminnier
Slides available: bit.ly/aacr-power
Slide code available at: github.com/jminnier/talks-etc
References
- Some of this talk adapted from: David Yanez's Sample Size talk at OCTRI Research Forum (OHSU)
- Statistical Rules of Thumb, Chapter 2
